Health Check System Overview
Application Monitoring
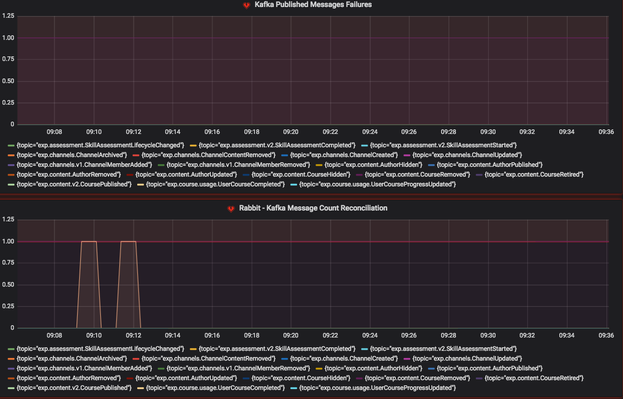
Our monitoring and internal alerting strategy is built around the idea of testing the "edges" of our systems. For hydra-connectors and hydra-ingest, we use a gauge (a metric abstraction that can be incremented or decremented) that is incremented as soon as a message is ingested.
We don't decrement the gauge until that message comes out the other side of the system. The gauge metrics are pushed up through Prometheus to our visualization tool, Grafana, where an alert is then set around the gauge remaining in a non-zero state for more than a certain interval of time.
We have a second alert set around messages that fail for some reason, be it validation, timeout, etc... This alerts us to many types of possible errors in the system, including messages piling up in a RabbitMQ queue, messages getting dropped between ingress and egress, or messages being duplicated inside the system.